Chapter 1 Introduction: Data from the Web
The diffusion of the Internet has led to a stark increase in the availability of digital data describing all kind of every-day human activities (Edelman 2012; Einav and Levin 2014; Matter and Stutzer 2015). The dawn of such web-based big data offers various opportunities for empirical research in economics and the social sciences in general. While web (data) mining has for many years rather been a discipline within computer science with a focus on web application development (such as recommender systems and search engines), the recent rise in well-documented open-source tools to automatically collect data from the web makes this endeavor more accessible for researchers without a background in web technologies. Web mining has recently been the basis for studies in various fields such as labor economics, finance, marketing, political science, as well as sociology.
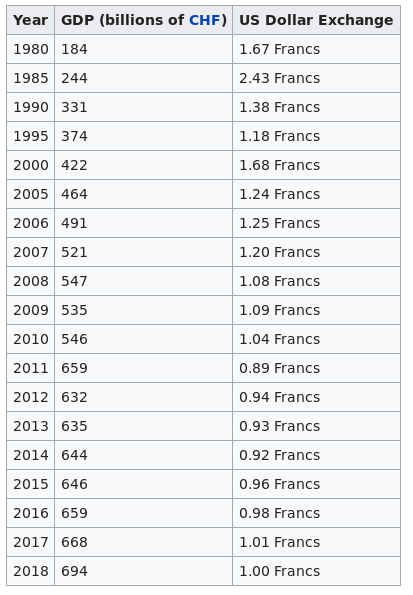
The collection and preparation of web data for research purposes also poses new challenges for social scientists. Web data often comes in unusual or unsuitable formats for statistical analysis. For example, the table depicted in Figure 1.1 (observed on Wikipedia’s Economy of Switzerland page), is easy to read and understand for the human eye as it appears on the screen.

Figure 1.1: Source: https://en.wikipedia.org/wiki/Economy_of_Switzerland.
However, if we were to use the information in this table as part of a data analysis task, we would like to have access to the underlying the raw data provided in this web document. The data contained in the source code of the website—written in the Hypertext Markup Language (HTML)—looks like this (middle rows omitted):
<table class="wikitable">
<tbody>
<tr>
<th>Year</th>
<th>
  <a href="/wiki/Swiss_franc" title="Swiss franc">
  CHF
</a>GDP (billions of )</th>
<th>US Dollar Exchange</th>
</tr>
<tr>
<td>1980</td>
<td>184</td>
<td>1.67 Francs</td>
</tr>
...
<tr>
<td>2015</td>
<td>646</td>
<td>0.96 Francs</td>
</tr>
</tbody>
</table>
The software applications we commonly use to read websites, so-called web browsers, are designed to render (i.e., parse/translate/visualize) HTML code for the human eye (e.g., visualizing the information contained in the gibberish code above as something more easily digestible). Thus, we commonly search, consume, and collect information stored somewhere on the web by means of an application that is optimized for human users clicking their way through a graphical interface. But what if we want to analyze and visualize such data?
A basic understanding of web technologies in combination with some freely available software packages for the statistical computing environment (and programming language) R (R Core Team 2021) empower us to automatically download, parse, and store web data in formats favorable for data analysis. Thereby, what happens ‘under the hood’ in our computer is not that different from what happens when we access the same data on the web with a browser. However, we have full control of what part of the data we access, and how we parse, format, store, and eventually analyze it. The following few lines of R code constitute a very simple example of what can be done (note the comments documenting what each line does).
# install and load the necessary R package
#install.packages("rvest") # if not installed yet
library(xml2)
library(rvest)

# fix vars
URL <- "https://en.wikipedia.org/wiki/Economy_of_Switzerland"

# 1) fetch and parse the website,
# save the parsed website in a variable called 'swiss_econ'
swiss_econ <- read_html(URL)
# 2) extract the html node containing the table
swiss_tab <-
  html_node(swiss_econ,
            xpath = "//*[@id='mw-content-text']/div/table[2]")
# 3) extract the table as a data-frame (a table-like R object)
swiss_tab <-
  html_table(swiss_tab)
# look at table (in R)
swiss_tab
## # A tibble: 19 × 3
## Year `GDP (billions of CHF)` `US dollar exchange`
## <int> <int> <chr>
## 1 1980 184 1.67 Francs
## 2 1985 244 2.43 Francs
## 3 1990 331 1.38 Francs
## 4 1995 374 1.18 Francs
## 5 2000 422 1.68 Francs
## 6 2005 464 1.24 Francs
## 7 2006 491 1.25 Francs
## 8 2007 521 1.20 Francs
## 9 2008 547 1.08 Francs
## 10 2009 535 1.09 Francs
## 11 2010 546 1.04 Francs
## 12 2011 659 0.89 Francs
## 13 2012 632 0.94 Francs
## 14 2013 635 0.93 Francs
## 15 2014 644 0.92 Francs
## 16 2015 646 0.96 Francs
## 17 2016 659 0.98 Francs
## 18 2017 668 1.01 Francs
## 19 2018 694 1.00 Francs# plot data (adjusting axes labels)
plot(x =swiss_tab$Year, y = swiss_tab$`GDP (billions of CHF)`,
xlab = "Year",
ylab = "GDP (billions of CHF)")While this very basic example has only limited advantages over a ‘manual’ approach to extracting the data of interest, it already contains the core aspects of web data mining (or web automation, web scraping). The few lines of code contain the core tasks we have to deal with when programmatically collecting data from the Web:
- Communicating with the (physical) data source (the web server). That is, programmatically requesting information from a particular website and handling the returned raw web data.
- Locating and extracting the data of interest from the document that constitutes the website.
- Serializing/reformatting the extracted data for further processing (analysis, visualization, storage).
Developing a basic understanding of these tasks as well as the practical skills necessary to perform them in simple applications is at the heart of this course. In order to get a better idea of why the acquisition of these skills can be of great interest to economists, social scientists, entrepreneurs, and responsible citizens in general, it is imperative to first have a closer look at what the Internet (and the World Wide Web (WWW)) is and how it ‘works’. Particularly, we need (i) a basic comprehension of the physical and technological dimension of the Internet in order to understand practical web data mining techniques and (ii) insights into the human and social dimension of the Web’s content and the production thereof in order to appreciate the opportunities web data mining provides to enrich our knowledge about the economy and society at large.