Introduction
“Men at some time are masters of their fates. The fault, dear Brutus, is not in our stars, but in ourselves, that we are underlings.”(Shakespeare 1599/2020)
Working with the complexity and size of Big Data is rarely as overwhelming and intimidating as when collecting and preparing the data for analysis. Even when working with small datasets, collecting and preparing data for analysis can easily consume more than two-thirds of an analytics project’s time. Larger datasets make the time-consuming tasks preceding the actual statistical analysis even more difficult, as the common tools and workflows for dealing with large datasets at the beginning of a project become overwhelmed and rendered useless.
In this part we aim to tackle these challenges by combining the conceptual basics of part I with the platform basics in part II and look at each practical step involved in analyzing Big Data in the context of applied econometrics/business analytics. Thereby, the focus is primarily on how to handle Big Data in order to gather, prepare, combine, filter, visualize, and summarize it for analytics purposes. That is, we cover all core practical tasks necessary before running more sophisticated econometric analyses or machine learning algorithms on the data. Each of these core tasks is summarized in a separate chapter, whereby the sequence of chapters follows a typical workflow/process in applied data science, usually referred to as data pipeline.
The data pipeline concept is useful to illustrate and organize the process from gathering/extracting the raw data from various data sources to the final analytics output. The concept of data pipelines thus helps us to structure all steps involved in a meaningful way. Figure 7.7 illustrates the data pipeline idea, which is consistent with the order and content of how the chapters in this book cover all the tasks involved in the first steps of a Big Data Analytics project. Initial, intermediate and final data entities are displayed as nodes in the flow diagram, and tasks/activities between these entities are displayed as arrows.
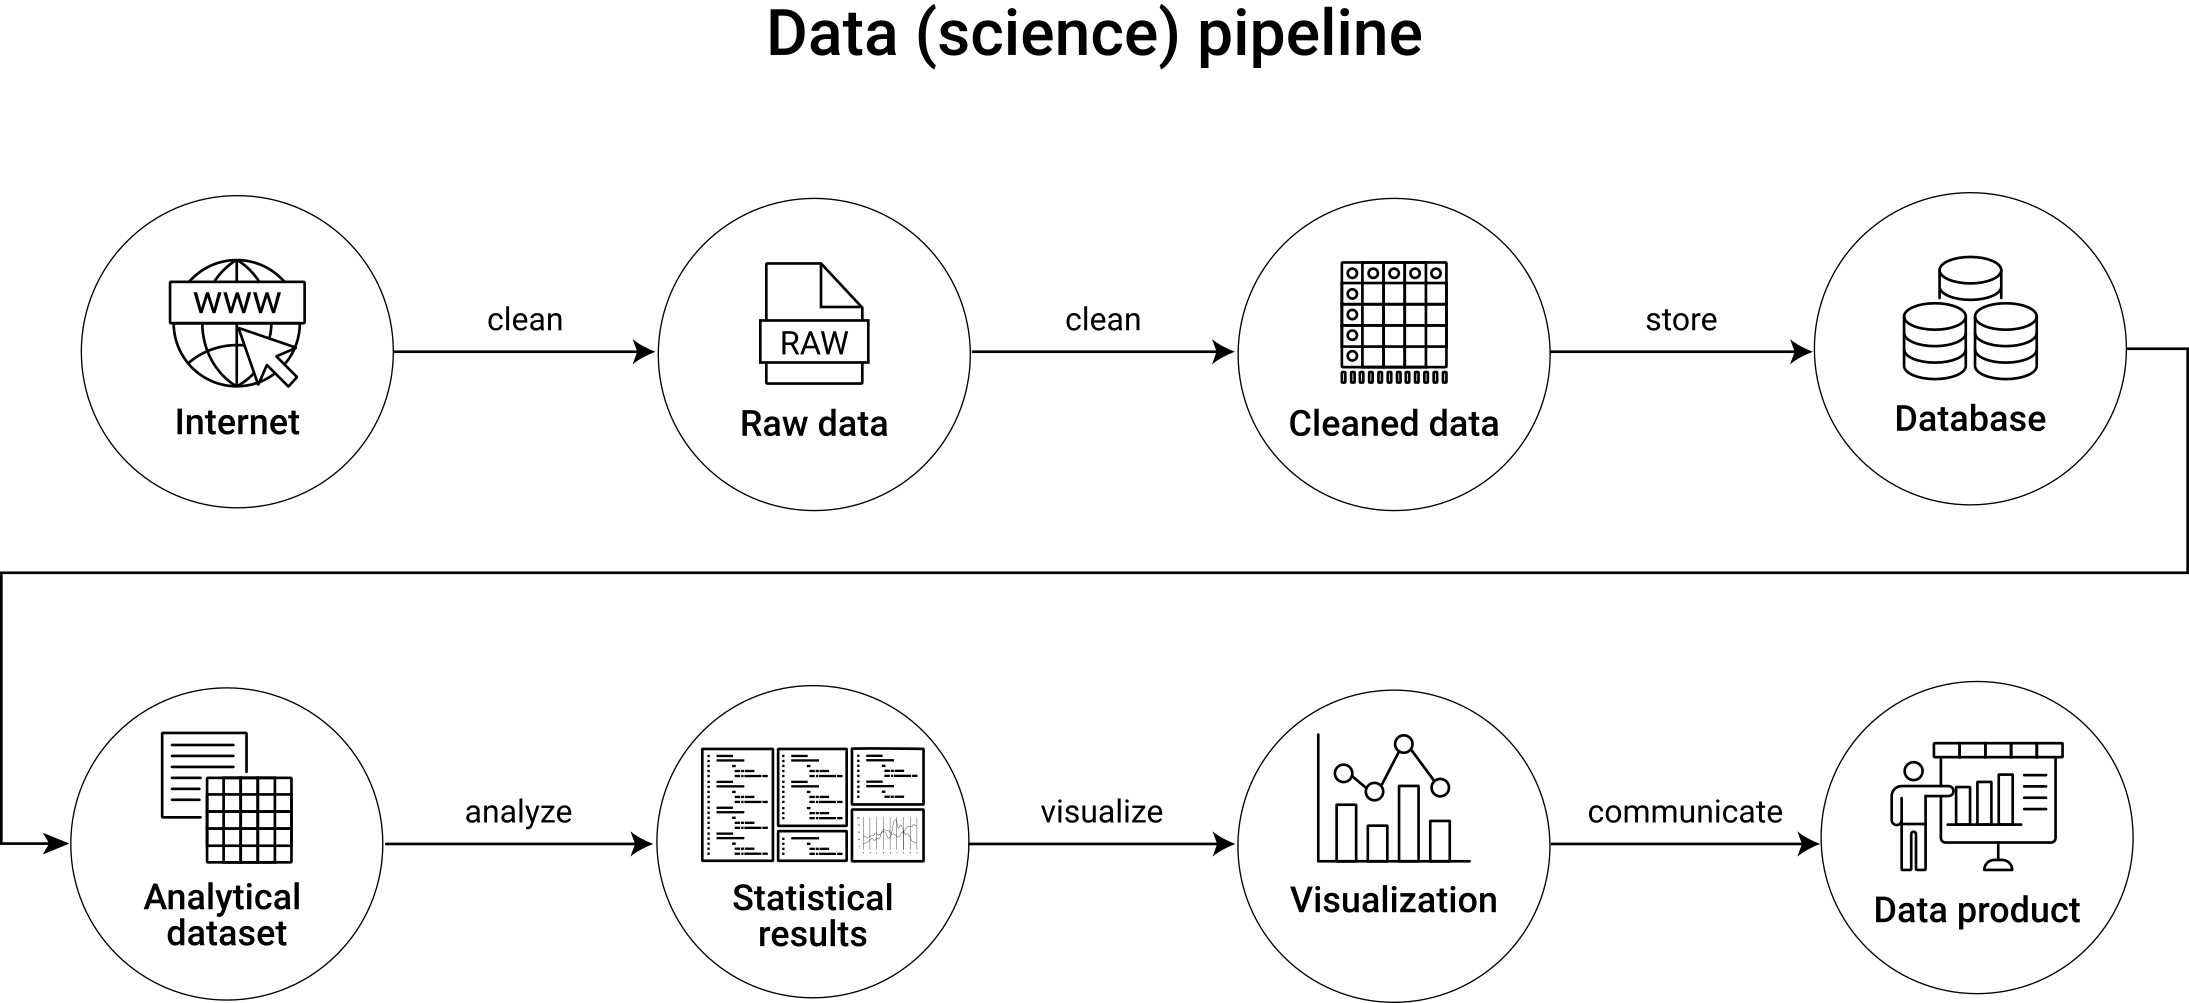
Figure 7.7: Illustration of a generic data pipeline in a data analytics project.
In many domains of modern data science, data pipelines also involve loops, indicating that certain parts of the overall process are iterative and repeated several times to further optimize and maintain the final data product. Such a perspective is typical in a context where the final data product is a dashboard or a (component of a) web application that is at some point deployed and runs in production. For the perspective of this book, we intentionally follow an acyclical concept of the data pipeline, representative of data projects in business analytics and applied economic research, in which raw data needs to be collected, processed, and analyzed with the aim of delivering statistical insights summarized in a report or presentation. In that sense, each chapter in this part builds on the previous one, and I recommend going through these chapters sequentially.
Note, though, that in your work it might make sense to slightly re-arrange some parts of the workflow suggested by the generic data pipeline illustrated here. In particular, you might want to first systematically collect and store all of the needed data and then only selectively load and transform/clean parts of this data for analysis (an approach usually referred to as Extract-Load-Transform (ELT), or, in contrast, you might want to directly clean all the gathered data and store all of the cleaned/prepared data in a cleanly structured database before turning to any analytics steps (as the pipeline illustration above would suggest, and which is typically referred to as Extract-Transform-Load (ETL)).
Aside: ETL vs. ELT
In traditional business analytics, a company’s raw/unstructured data was typically handled and prepared by IT specialists and then provided in a final clean/transformed analytic dataset to the data analysts. Such a process can generally be described as Extract-Transform-Load (ETL). In ETL the data analyst is only presented with the final well-structured database containing all variables and observations (e.g., in a traditional SQL database). The data pipeline illustration above basically follows the ETL idea in the sense that raw data is gathered/extracted, then cleaned, and then stored in a structured format before it is queried and analyzed. With large amounts of data from various sources with frequent updating (as is typical for Big Data), this process is rather slow and might be inefficient in the sense that parts of the raw data might in the end not play an important role in the data analytics project.
Nowadays, with data analysts and data scientists being increasingly familiar with data technologies and how to handle raw/unstructured data, a more flexible process called Extract-Load-Transform (ELT) is followed. In ELT, raw data is extracted and then ingested into/stored in more flexible frameworks than traditional SQL databases that allow for more diverse data structures, such as data warehouses, or do not require the data to be structured, such as data lakes. The transformation of the data for analytics purposes is then done on demand and practically often involves the same person later analyzing the data.
Importantly, for the perspective on data analytics in this book, either process involves the components illustrated in the pipeline above in one way or another. However, the order of the individual steps varies between ETL and ELT.