Chapter 2 Approaches to Analyzing Big Data
Throughout the book, we consider four approaches to how to solve challenges related to analyzing big N and big P data. Those approaches should not be understood as mutually exclusive categories; rather they should help us to look at a specific problem from different angles in order to find the most efficient tool/approach to proceed. Figure 2.1 presents an illustrative overview of the four approaches.
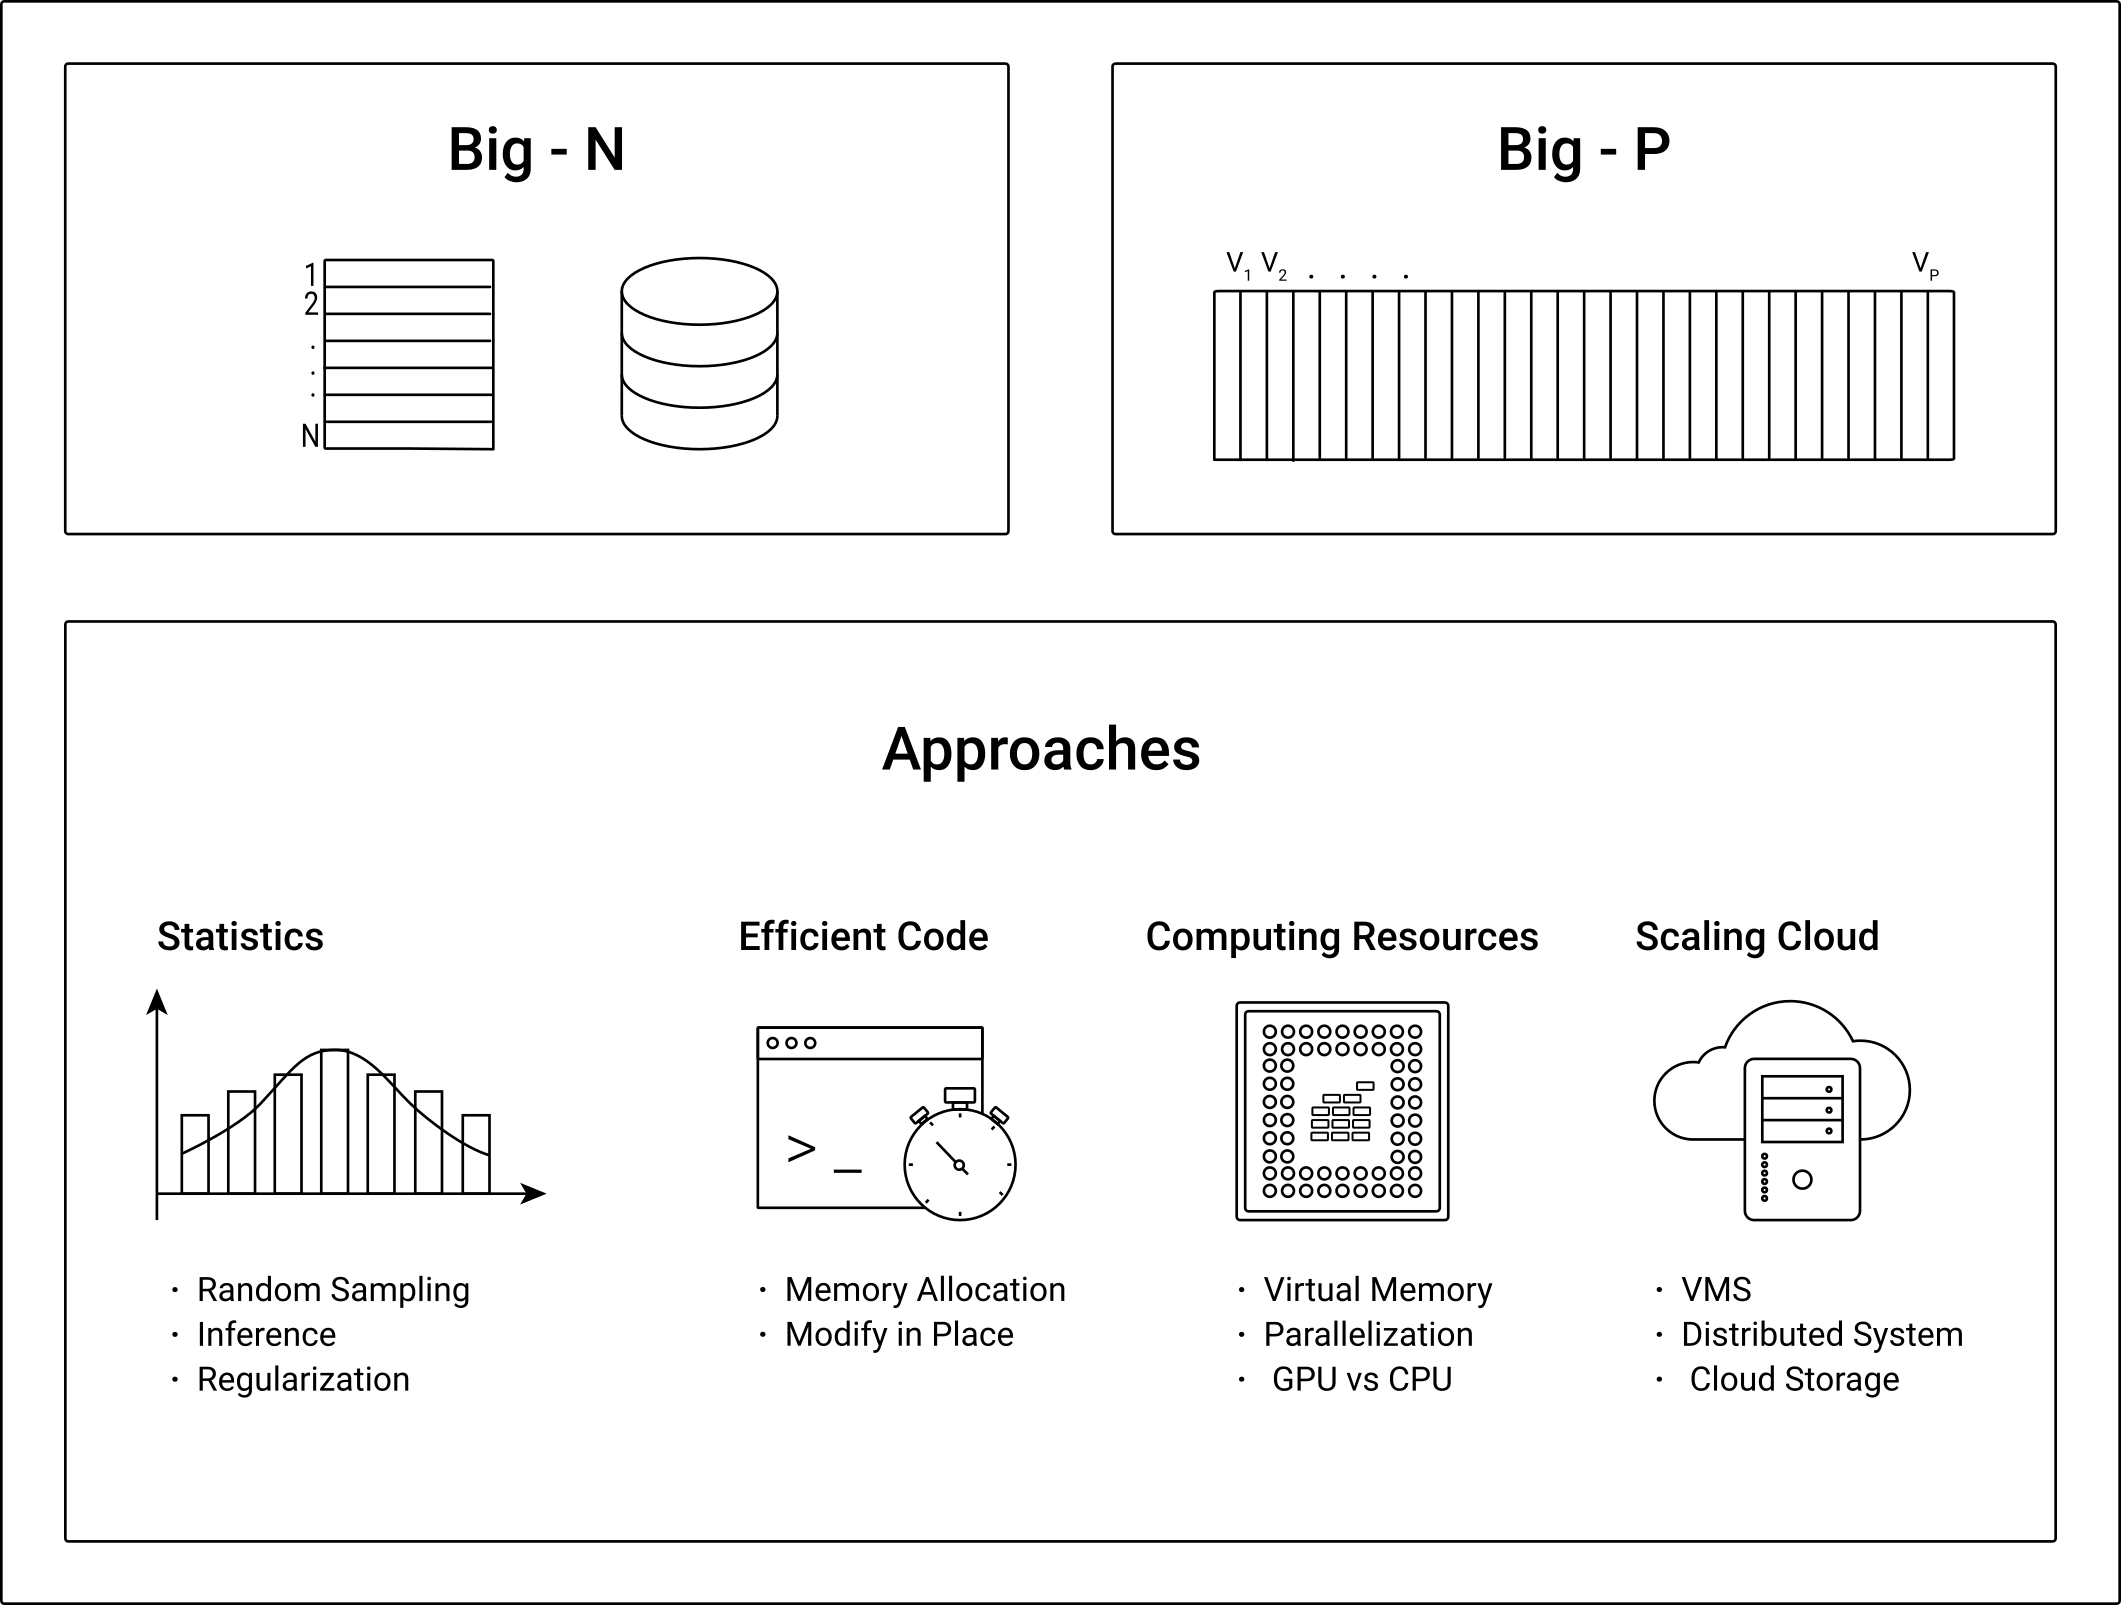
Figure 2.1: Four approaches to/perspectives on solving big N problems in data analytics.
Statistics/econometrics and machine learning: During the initial hype surrounding Big Data/Data Science about a decade ago, statisticians prominently (and justifiably) pointed out that statistics techniques that have always been very useful tools when analyzing “all the data” (the entire population) is too costly.1 In simple terms, when confronted with the challenge of answering an empirical question based on a big N dataset (which is too large to process on a normal computer), one might ask “why not simply take a random sample?” In some situations this might actually be a very reasonable question, and we should be sure to have a good answer for it before we rent a cluster computer with specialized software for distributed computing. After all, statistical inference is there to help us answer empirical questions in situations where collecting data on the entire population would be practically impossible or simply way too costly. In today’s world, digital data is abundant in many domains, and the collection is not so much the problem any longer; but our standard data analytics tools are not made to analyze such amounts of data. Depending on the question and data at hand, it might thus make sense to simply use well-established “traditional” statistics/econometrics in order to properly address the empirical question. Note, though, that there are also various situations in which this would not work well. For example, consider online advertising. If you want to figure out which user characteristics make a user significantly more likely to click on a specific type of ad, you likely need hundreds of millions of data points because the expected probability that a specific user clicks on an ad is generally very low. That is, in many practical Big Data Analytics settings, you might expect rather small effects. Consequently, you need to rely on a big N dataset in order to get the statistical power to distinguish an actual effect from a zero effect. However, even then, it might make sense to first look at newer statistical procedures that are specifically made for big N data before renting a cluster computer. Similarly, traditional statistical/econometric approaches might help to deal with big P data, but they are usually rather inefficient or have rather problematic statistical properties in such situations. However, there are also well-established machine learning approaches to better address these problems. In sum, before focusing on specialized software like Apache Hadoop or Apache Spark and scaling up hardware resources, make sure to use the adequate statistical tools for a Big Data situation. This can save a lot of time and money. Once you have found the most efficient statistical procedure for the problem at hand, you can focus on how to compute it.
Writing efficient code: No matter how suitable a statistical procedure is theoretically to analyze a large dataset, there are always various ways to implement this procedure in software. Some ways will be less efficient than others. When working with small or moderately sized datasets, you might not even notice whether your data analytics script is written in an efficient way. However, it might get uncomfortable to run your script once you confront it with a large dataset. Hence the question you should ask yourself when taking this perspective is, “Can I write this script in a different way to make it faster (but achieve the same result)?” Before introducing you to specialized R packages to work with large datasets, we thus look at a few important aspects of how to write efficient/fast code in R.
Using limited local computing resources more efficiently: There are several strategies to use the available local computing resources (your PC) more efficiently, and many of those have been around for a while. In simple terms, these strategies are based on the idea of more explicitly telling the computer how to allocate and use the available hardware resources as part of a data analytics task (something that is usually automatically taken care of by the PC’s operating system). We will touch upon several of these strategies – such as multi-core processing and the efficient use of virtual memory – and then practically implement these strategies with the help of specialized R packages. Unlike writing more efficient R code, these packages/strategies usually come with an overhead. That is, they help you save time only after a certain threshold. In other words, not using these approaches can be faster if the dataset is not “too big”. In addition, there can be trade-offs between using one vs. another hardware component more efficiently. Hence, using these strategies can be tricky, and the best approach might well depend on the specific situation. The aim is thus to make you comfortable with answering the question, “How can I use my local computing environment more efficiently to further speed up this specific analytics task?”
Scaling up and scaling out: once you have properly considered all of the above, but the task still cannot be done in a reasonable amount of time, you will need to either scale up or scale out the available computing resources. Scaling up refers to enlarging your machine (e.g., adding more random access memory) or switching to a more powerful machine altogether. Technically, this can mean literally building an additional hardware device into your PC; today it usually means renting a virtual server in the cloud. Instead of using a “bigger machine”, scaling out means using several machines in concert (cluster computer, distributed systems). While this also has often been done locally (connecting several PCs to a cluster of PCs to combine all their computing power), today this too is usually done in the cloud (due to the much easier set up and maintenance). Practically, a key difference between scaling out and scaling up is that by-and-large scaling up does not require you to get familiar with specialized software. You can simply run the exact same script you tested locally on a larger machine in the cloud. Although most of the tools and services available to scale out your analyses are by now also quite easy to use, you will have to get familiar with some additional software components to really make use of the latter. In addition, in some situations, scaling up might be perfectly sufficient, while in others only scaling out makes sense (particularly if you need massive amounts of memory). In any event, you should be comfortable dealing with the questions, “Does it make sense to scale up or scale out?” and “If yes, how can it be done?” in a given situation.2
Whether one or the other approach is “better” is sometimes a topic hotly debated between academics and/or practitioners with different academic backgrounds. The point of the following chapters is not to argue for one or the other approach, but to make you familiar with these different perspectives in order to make you more comfortable and able to take on large amounts of data for your analytics project. When might one or the other approach/perspective be more useful? This is highly context-dependent. However, as a general rule of thumb, consider the order in which the different approaches have been presented above.
First, ask yourself whether there isn’t an absolutely trivial solution to your big N problem, such as taking a random sample. I know, this sound banal, and you would be surprised at how many books and lectures focusing on the data engineering side of big N do not even mention this. But, we should not forget that the entire apparatus of statistical inference is essentially based on this idea.3 There is, however, a well-justified excuse for not simply taking a random sample of a large dataset. Both in academic research and in business data science and business analytics, the decision to be facilitated with data might in any event only have measurable consequences in rather a few cases. That is, the effect size of deciding either for A or B is anyway expected to be small, and hence we need sufficient statistical power (large N) to make a meaningful decision.
Second, once you know which statistical procedure should be run on which final sample/dataset, be aware of how to write your analytics scripts in the most efficient way. As you will see in Chapter 4, there are a handful of R idiosyncrasies that are worth keeping in mind in this regard. This will make interactive sessions in the early, exploratory phase of a Big Data project much more comfortable.
Third, once you have a clearer idea of the bottlenecks in the data preparation and analytics scripts, aim to optimize the usage of the available local computing resources.
In almost any organizational structure, be it a university department, a small firm, or a multinational conglomerate, switching from your laptop or desktop computer to a larger computing infrastructure, either locally or in the cloud, means additional administrative and budgetary hurdles (which means money and time spent on something other than interpreting data analysis results). That is, even before setting up the infrastructure and transferring your script and data, you will have to make an effort to scale up or scale out. Therefore, as a general rule of thumb, this option will be considered as a measure of last resort in this book.
Following this recommended order of consideration, before we focus extensively on the topics of using local computing resources more efficiently and scaling up/out (in parts II and III of this book, respectively), we need to establish some of the basics regarding what is meant by statistical/econometric solutions for big P and big N problems (in the next chapter), as well as introducing a couple of helpful programming tools and skills for working on computationally intense tasks (in Chapter 4).
References
David Donoho has nicely summarized this critique in a paper titled “50 Years of Data Science” (Donoho (2017)), which I warmly recommend.↩︎
Importantly, the perspective on scaling up and scaling out provided in this book is solely focused on Big Data Analytics in the context of economic/business research. There is a large array of practical problems and corresponding solutions/tools to deal with “Big Data Analytics” in the context of application development (e.g. tools related to data streams), which this book does not cover.↩︎
Originally, one could argue, the motivation for the development of statistical inference was rather related to the practical problem of gathering data on an entire population than handling a large dataset with observations of the entire population. However, in practice, inferring population properties from a random sample also works for the latter.↩︎